|
|
|
The following images were intentionally not all created in the same way or using the same settings, in an effort to show some of the varied capabilities of the Rapid Visualization Tool Workstation (RVT) as a product generation tool. With some of the images, high-resolution loops or animations are available. These high-resolution loops and animations may take a few minutes to fully load and require your browser to have the Java plug-in. Most users have the Java plug-in by default. If you have any questions about the RVT or exporting images, please contact us. For a larger view of any of the thumbnails, click on the images below. |
|
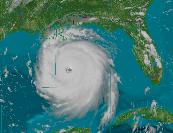
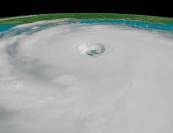
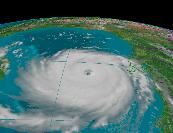
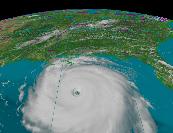
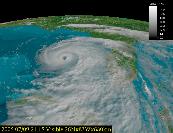
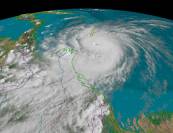
Hurricane Katrina devastated Louisiana and other parts of the United States in August of 2005, killing over a thousand people and causing billions of dollars worth of damage. The views of this category 5 hurricane are from the RVT Workstation. |
|
|
|
|
|
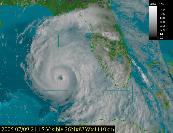
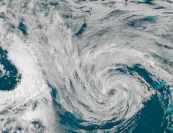
The Visible Channel view of Hurricane Katrina. |
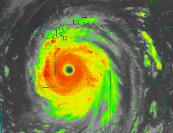
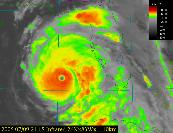
The Infrared Channel, shown with color enhancement. |
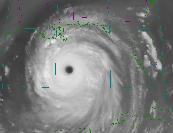
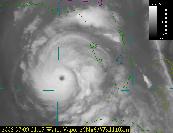
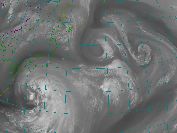
The Water Vapor Channel, shown with standard settings. |

|
|
|
|
|
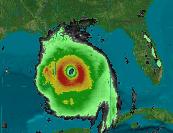
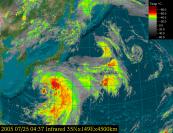
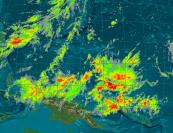
The 3 Hour Rainfall Rate derived channel, showing estimated precipitation intensities of the hurricane. |
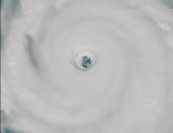
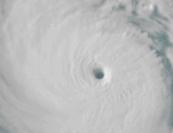
The Visible Channel displaying a close-up view of the hurricane's eye, shown with relief. Click on the image to view the contrast between images with and without relief. |
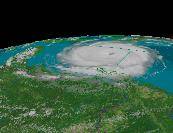
The Visible Channel, looking west into the Gulf of Mexico at an altitude of 750 km and a 46 degree viewing angle. |
|
|
|
|
|
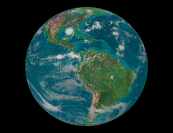
The Visible Channel at an altitude of 900 km and a 40 degree angle. |
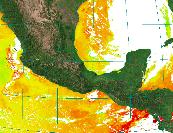
The Sea Surface Temperature (SST) Channel, showing temperatures on the ocean's surface for areas not obstructed by clouds (shown in white). The deeper red is due to the sun's overhead position and Katrina is in the upper right. |
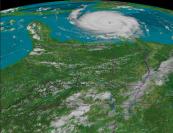
A view of Katrina from the Southern US, looking south. Such a view is particular impressive when looping image data of the oncoming storm. |
|
|
|
|
|
An animation of zooming in on Hurricane Katrina. While we significantly compressed the images, this animation through space may still take several minutes to load. |
An animation of flying over Hurricane Katrina. While we significantly compressed the images, this animation through space may still take several minutes to load. |
An animation of flying south towards Hurricane Katrina. While we significantly compressed the images, this animation through space may still take several minutes to load. |

Rapid Visualization Tool (RVT) Features
|
The Rapid Visualization Tool (RVT) is a powerful piece of software to work with and display image data. More information and specifications for the RVT are available on our Products page. |
|
|
|
|
|
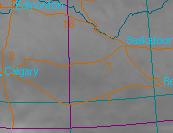
A user-defined overlay, showing major Canadian cities and highways. User-defined overlays may include text, lines, and points in any color. |
The Visible Channel, showing albedo values of Hurricane Dennis from July 2005. The albedo value to color mapping is adjustable. |
The Infrared Channel with a colored enhancement, showing temperature values. The temperature value to color mapping is adjustable. |
|
|
|
|
|
The Water Vapor Channel with standard settings, showing cloud top temperatures. The temperature value to color mapping is adjustable. |
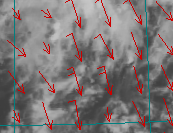
The Cloud Motion Vector Channel, displaying estimated cloud motion direction and magnitude. |
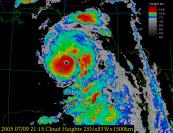
The Cloud Height Channel, displaying cloud heights in km, with an adjustable scale. |
|
|
|
|
|
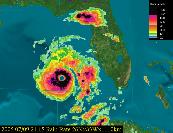
The Rainfall Rate Channel, showing estimated rainfall in mm/hr, with an adjustable color to rainfall mapping. |
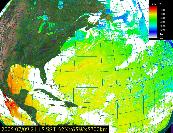
The Sea Surface Temperature (SST) Channel, showing data for regions not blocked by clouds (shown in white). |
The Visible Channel, looking in a NW direction at Hurricane Dennis. |
Tropical Cyclone Mala, 4.28.2006
|
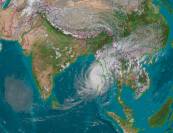
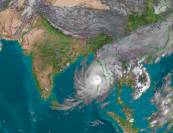
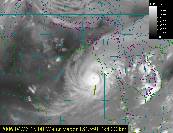
Tropical Cyclone Mala, the strongest tropical cyclone in northern India's 2006 season, formed in the Bay of Bengal in February 2006, before heading towards Myanmar. The storm reached a minimum pressure of 916 mb, and achieved sustained peak winds at 210 knots. The views of this storm are from FY-2 data, shown on the RVT Workstation. |
|
|
|
|
|
The Visible Channel, at an altitude of 4000km. |
The Infrared Channel, with the default gray scale color palette. |
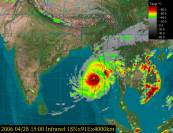
The Infrared Channel, with color enhancement. |
|
|
|
|
|
The Water Vapor Channel, showing cloud top temperatures. |
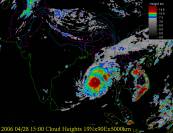
The Cloud Height Channel, providing estimated heights for the upper layers of clouds. |
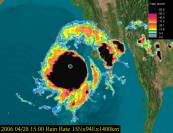
The Rainfall Rate Channel, showing some regions with precipitation in excess of 65 mm/hr. |
|
|
|
|
|
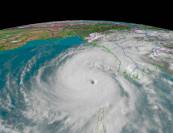
The Visible Channel, showing the cyclone approaching land at a 50 degree viewing angle. |
The Visible Channel, looking into the Bay of Bengal at the approaching storm. |
An animation flying north, towards the storm in the Bay of Bengal. While we significantly compressed the images, this animation through space may still take several minutes to load. |
MTSAT Storm Imagery, Including Tropical Storm Banyan, 7.25.2005
|
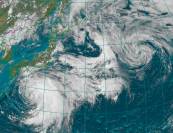
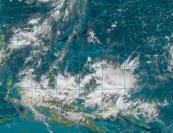
On July 25, 2005 Tropical Storm Nalgae was dissipating while Tropical Storm Banyan was approaching Japan, and there were numerous smaller storms in the South Pacific. This MTSAT imagery shown here was exported from the RVT Workstation. |
|
|
|
|
|
The Visible Channel view of Tropical Storm Banyan (left) and the remnants of Tropical Storm Nalgae (upper right). |
The Infrared Channel view of Tropical Storm Banyan. |
The Water Vapor Channel view of Banyan. |
|
|
|
|
|
An animation of flying over Nalgae, then Banyan. While we significantly compressed the images, this animation through space may still take several minutes to load. |
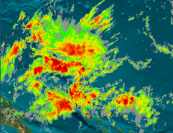
The Visible Channel view of storms in the South Pacific. |
The Infrared Channel view of storms in the South Pacific. |
|
|
|
|
|
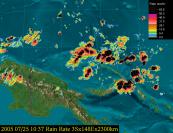
The Rainfall Rate Channel giving precipitation estimates for storms in the South Pacific. |
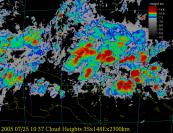
The Cloud Height Channel view of storms in the South Pacific. |
An animation of flying from east to west, observing storms in the South Pacific. While we significantly compressed the images, this animation through space may still take several minutes to load. |

|
860.886.8368 info@automatedsciences.com |
© 2012 Automated Sciences, LLC | Conditions and Terms of Use