Weather Satellite Systems 101
If you are considering investing in a weather satellite system but have limited experience with them, in this section we hope to provide you with a foundation of background knowledge of the data the satellites provide and the ground equipment you need to access and make use of that data.
Weather Satellite System Components

Weather Satellite Systems consist of two main groups of components: the ground segment and the space segment. International meteorological organizations and space agencies supply the space segment, and Automated Sciences provides all of the equipment you need for the ground segment to receive and display the weather satellite data.
The Space Segment
The space segment is controlled by international meteorological organizations, which have launched a number of geostationary and polar-orbiting satellites. These satellites transmit data via a radio frequency carrier at microwave frequencies between 1680-1720MHz. The data from these satellites is available to anyone who has the proper equipment to receive, interpret and display the data.
|
Geostationary satellites are those that circle the earth at the same speed as the earth's rotation, such that they are always above the same location, monitoring that given region by supplying meteorologists with a new data set for that area every 15 to 60 minutes. There are two Geostationary-orbiting Operational Environmental Satellites (GOES) that provide data to the Western Hemisphere: GOES-West, located over the eastern part of the Pacific Ocean at 135° W and GOES-East, centered at 75° W. Europe has a GOES satellite covering their region at 0° E, called Meteosat. The Chinese Meteorological Administration's (CMA) GOES Satellite, known as Feng Yun 2 (FY-2), is located at 105° E. The Japan Meteorological Agency's (JMA) GOES Satellite is called MT-SAT, and is located at 135° E. Geostationary satellites orbit the earth in the Clarke Belt, which is located 36,000 km (22,000 mi) above the equator, which is the only latitude that allows for stable, geostationary orbits. GOES satellite coverage areas are shown in the diagram to the right.
Geostationary satellites provide visible data at a resolution of 1 km, and multi-spectral infrared imagery at a 4 km resolution. Since each satellite is always imaging from the same location, GOES data may be easily put into time-lapsed animated loops to watch weather conditions develop, and GOES data is used to track storms and estimate precipitation. View a sample GOES full disk data set taken from GOES East.
|
|
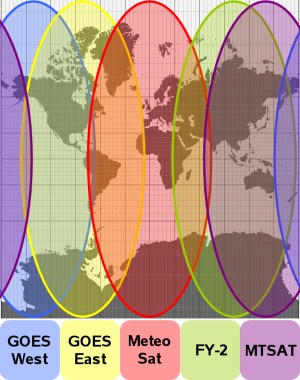
Areas of the Earth Covered by each of the Operational GOES Satellites
|
|
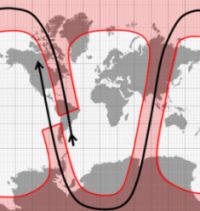 POES Satellite Path shown in black, with approximate Coverage Area, shown in red
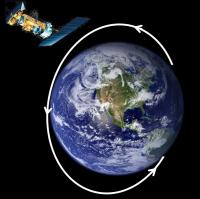 Polar Orbiting Path
|
In the United States, Polar-orbiting Operational Environmental Satellites (POES) are run cooperatively by the National Aeronautics and Space Administration (NASA), which launches the satellites, and the National Oceanic and Atmospheric Administration (NOAA), which runs the satellites. The Chinese Meteorological Administration also has a polar orbiting satellite. Polar orbiting satellites, as their name suggests, pass approximately over the North and South Poles in their orbit, alternating between ascending and descending passes. For example, a polar orbiting satellite may pass close to the North Pole, descend from North to South crossing perpendicular to the equator, pass near the South Pole, and then again begin an ascent toward the North Pole. Users receive POES data as the POES satellites rise over their radio horizon, pass near their location, and then descend over their opposite radio horizon; such an event is called a satellite pass. Polar orbiting satellites are either in morning or afternoon satellites; depending on when they make their passes. Because POES satellites are in sun-synchronous orbits, a morning POES satellite might, for example, collect global data at about 9am for each region it passes over.
POES satellites provide more detailed data than GOES satellites as they orbit much closer to earth, at an altitude of about 800 km (500 mi). The primary instrument of the POES satellite is the Advanced Very High Resolution Radiometer (AVHRR), which provides 1 km resolution data in all spectral channels, with data sets that are approximately 3,000 km wide. POES satellites also include atmospheric sounding instruments. Each continuously orbiting satellite provides POES imagery at least twice daily at every location on earth. The high resolution data from POES is useful for weather forecasting, determining sea surface temperatures, monitoring volcanic ash, observing dust storms, and fire/smoke detection.
|
The Ground Segment
The ground segment consists of all of the equipment needed to gather and use the data sent down by the GOES and POES satellites. Once you have acquired ground segment equipment you may freely receive weather satellite data from your available satellites.
Automated Sciences provides all of the equipment you need for the ground segment. The supplied satellite dish and integrated feed with downconverter focus the microwave signal and downconvert the RF carrier's frequency. This RF signal is then passed along via a cable to the GOES Box or POES Box, which have specialized receivers to demodulate the scientific data and save it on a hard drive so that it may be accessed by software. Because you are provided with scientific data from the satellite, you may choose how you wish to view and work with the data stream and how you want the images to be displayed. The user can work with individual images and enhance them in a variety of ways to aid in weather forecasting or other tasks. One popular way to view this satellite data is to use a time-lapse loop of a series of consecutive images to show storm motion, such as shown in this Time-Lapse Loop of Tropical Storm Mala. Or, in a given data set, you may smoothly animate through space to view details of a storm, such as shown in this Animation Through Space of Hurricane Katrina. The Time-Lapse Loop may take several moments to load and the Animation Through Space may take several minutes to load.
There are a number of ground segment options available depending on from which satellites the data will be received and how you will be using the data; these options are listed on our Products page.
|
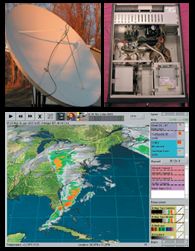 GOES dish with feed, workstation, and software GOES dish with feed, workstation, and software
|
Satellite Imagery
The imagery provided directly from satellites is available in real-time, so you receive the satellite data as it is transmitted and your system stores it on the hard drive, enabling the data to be immediately worked with and viewed. The data sets from the satellites are multi-megapixel and multi-spectral, and in addition to the weather satellite image data include navigation, calibration, and status information. These data sets are not just images, but scientific measurements made with a radiometer, which detects and measures electromagnetic radiation from earth. Thus, with the proper software, this numerical data may be calibrated such that the temperature or albedo values of the data may be determined, the data may be displayed as an image in one of the measured spectral channels according to user-defined settings, and images or loops may be enhanced in ways to best view a given high-resolution data set. To facilitate comparisons among the channels and multi-spectral algorithms, the spectral channels within each data set are co-registered. The images produced can be saved or exported.
Most of the images below are of Hurricane Wilma, a category 5 storm that damaged areas of the Yucatan Peninsula and Florida near the end of the 2005 hurricane season. Click on the small thumbnail images to view larger versions.
The visible (VIS) channel shows the weather conditions as seen from space in the wavelengths visible to the human eye: 0.55-0.75 um, so it looks as though these images are simply taken with a very high-resolution camera. The visible channel displays how much light is reflected from the clouds. A high albedo value signifies that more light is being reflected; this is often seen with clouds or snow. The visible channel's 1 km resolution allows fine details of cloud tops and land to be seen, and dust and smoke may also be viewed in this channel. Since this channel is based on energy from the sun that is reflected from the earth to create its images, visible imagery is only available during daylight hours.
|
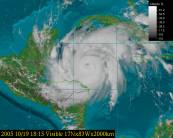
The Visible Channel
|
The satellites offer several infrared (IR) channels, each of which measures a different spectral wavelength to show different features. In contrast to the visible channel, the IR channels provide data 24 hours a day as they do not depend on the reflection of sunlight.
The long-wave infrared channel (LWIR) is the most important of the IR channels for meteorological purposes. It is optimized for showing cloud top temperatures. Using empirical algorithms, atmospheric cloud heights may be determined from cloud top temperatures.
The shortwave infrared channel (SWIR), measuring radiation levels between 3.8-4.0 um, may be used to show land and sea surface temperatures. When used with other channels, this channel may be used to show fog and other low-level atmospheric phenomena.
|
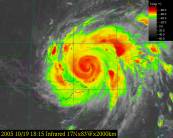
The Infrared Channel, with color enhancement
|
The water vapor (WV) channel, used to show the moisture levels and air movement patterns of the middle and upper atmosphere, is a special IR channel at the wavelength where water vapor absorbs infrared energy. Portions of the atmosphere that have higher concentrations of water vapor absorb more energy between 6.5 um and 7.4 um, and for these moist regions the satellite detects less energy. Generally the white sections in a water vapor image represent moist sections of air in the upper troposphere, which are usually clouds, while darker portions of water vapor images represent dry regions. Gray areas typically represent areas of high humidity, but not necessarily clouds.
|
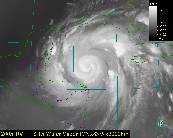
The Water Vapor Channel
|
The visible channel and infrared channels are standard channels that display the data collected by the satellite. With this data, other information and channels may be automatically derived, including the rainfall rate channel, sea surface temperatures, and cloud motion vectors.
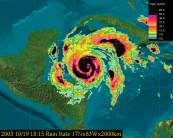
The Rainfall Rate Channel
|
The rainfall rate (RR) channel identifies the probable rainfall rate of convective cells. Using data from the infrared channel, algorithms yield the approximate rainfall rate, based on the fact that cooling and expanding cloud tops produce the most precipitation. The rainfall rate channel calculated from satellite data may be preferred over rain gauges, which are not real-time and which each provide only discrete data points, covering an area much smaller than that available with satellite imagery. The rainfall rate channel and the associated cumulative rainfall channel may be used to as a tool to show heavy rains and better predict flooding.
|
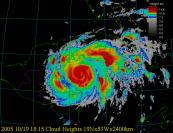
The Cloud Height Channel
|
The Cloud Height channel provides estimated cloud top heights, estimated empirically from infrared data temperatures. This empirical derivation, in addition to cloud top temperature, also considers the latitude. Cloud height estimates are only accurate for thick, middle to upper atmosphere single-layer clouds.
|
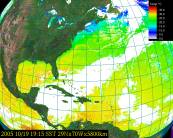
The Sea Surface Temperature Channel
|
The sea surface temperature (SST) channel calculates the temperature of the very surface of the ocean from infrared channel satellite data. SST data is important to fishermen and boaters, and meteorologists use the data to aid in the prediction of coastal fog and low-level cloud development. High SSTs are monitored as they are often a factor associated with tropical storm intensification. The sea surface temperature can only be calculated for oceanic regions not obstructed by clouds, so cloud covered areas of the ocean are displayed in white to signify the unavailability of data. Because the SST measures the very top layer of the ocean, the measurement is sensitive to solar reflection and surface evaporation.
|
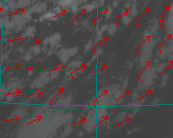
Cloud Motion Vectors
|
Cloud motion vectors provide the user with an idea of the overall direction and intensity of cloud movement in an image. These vectors are automatically obtained through examining a series of consecutive images and the cloud features within them, and tracking how those features move from one image to another. Longer arrows and those with more barbs represent vectors with higher velocities. The direction and speed at which clouds move fairly closely reflects winds in the middle and upper atmosphere.
|
Satellite Systems: A One Time Investment
With many communications services, even when you own the equipment there are monthly fees required to be able to access the data. With weather satellites, once you own the ground segment equipment you may continue to receive data for as long as the space segment provides it, for no additional fees.
Countries that operate weather satellites have committed to the World Meteorological Organization (WMO) to operate these satellites, to the extent that it is technically possible, for the foreseeable future at no charge. The one exception to this is that the reception of data from the European satellites does, in some cases, require a monthly fee.
As governments and meteorological agencies continue to invest in weather satellites, buying a system is a one-time investment for years of weather satellite imagery.
Further Reading
We hope that you have found this page informative. While we have tried to make this introduction reasonably comprehensive, given the scope of the material you may have other questions. You may find the following sites helpful, and of course you are welcome to contact us.
Japan Meteorological Agency | http://www.jma.go.jp/jma/indexe.html
Includes information on MT-SAT operations.
NASA's GOES Project | http://goespoes.gsfc.nasa.gov/goes/index.html
Includes a list of spacecraft, their instruments, and launch information.
NASA's POES Project | http://goespoes.gsfc.nasa.gov/poes/index.html
Includes a list of spacecraft, their instruments, and launch information.
NOAA's Environmental Satellites: A History | http://www.oso.noaa.gov/history/index.htm
Details the history of the POES, GOES and international satellite programs.
NOAA's Geostationary Satellite Server | http://www.goes.noaa.gov/
Contains recent GOES imagery.
NOAA's Office of Satellite Operations: GOES | http://www.oso.noaa.gov/goes/index.htm
Provides announcements and operation reports.
NOAA's Office of Satellite Operations: POES | http://www.oso.noaa.gov/poes/index.htm
Provides announcements and operation reports.

© 2012 Automated Sciences, LLC | Conditions and Terms of Use

|